

Microsoft Power BI
Microsoft Power BI is a collection of software services, apps, and connectors that work together to turn unrelated sources of data into coherent, visually immersive, and interactive insights. Data may be an Excel spreadsheet, or a collection of cloud-based and on-premises hybrid data warehouses.
Microsoft Power BI connects to and visualizes any data using the unified, scalable platform for self-service and enterprise business intelligence (BI) that’s easy to use and helps users gain deeper data insight.
Create different dashboards with Asite Platform
How Microsoft Power BI integrates with Asite
Power BI reports can now be embedded into the Asite Platform dashboard, enabling fast and easy access to user’s project data. Users can aggregate, analyze, visualize, and share their data on Asite via Power BI reports. The accessibility to this data enables users to make more data-driven informed decisions, helping to build better capital projects and infrastructure developments worldwide.
How the integration works:
- Asite has created data connectors to extract and present Asite data in Power BI.
- These reports can then be seamlessly embedded on a users’ unique Asite dashboard, providing greater project visibility.
- To ensure that Asite users get the most from the new integration, Asite has a built Power BI Report Templates, which are premade reports that can be personalized and redesigned to meet user needs.
Integration highlights
Four different reports are available and can be embedded into Asite user dashboards. This includes Common Data Environment, Defects, Health & Safety, and Project Financials.
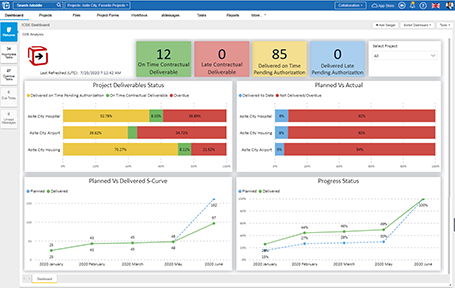
Common Data Environment Dashboard
- The powerful Common Data Environment (CDE) dashboard enables project teams with a portfolio view of all ongoing projects.
- It provides information on the status of project deliverables, a break-down of planned versus actual deliverables, key indicators, and S-Curves – a graphical report displaying the overall progress of a project.
- All information is represented in clear, accurate graphs.
- The reports further list all document information and corresponding placeholders by the contractual deliverables and status.
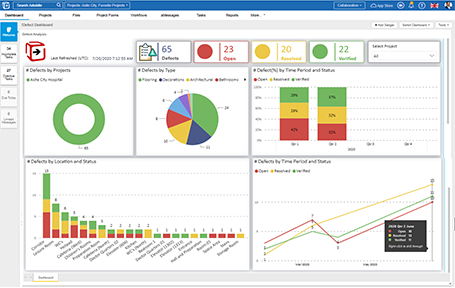
Defects Dashboard
- The Defects dashboard provides an overview of all site tasks (defects, snags, punch-lists) across ongoing projects allowing users to understand how site tasks in the selected project are trending at configurable intervals.
- Displayed in pie charts and line charts, defects are broken down by location, time period, and status.
- In a few simple clicks, users can access the defect's corresponding form through embedded hyperlinks, and update necessary values.
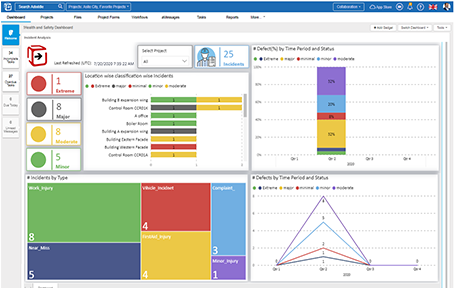
Health & Safety Dashboard
- The Health and Safety dashboard provides project managers with overview of the hazards and incidents within their businesses.
- Incident information is broken down by type, location, time period, and status.
- Similarly, to the Defects dashboard corresponding forms can be access through embedded hyperlinks and updated accordingly.
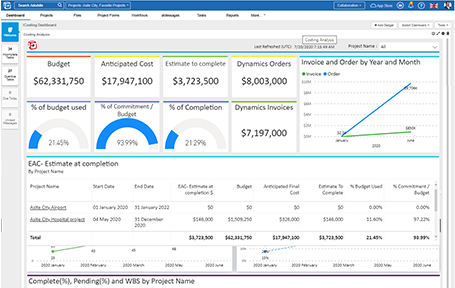
Project Financials Dashboard
- The Project Financials dashboard provides project owners and contractors with clear visibility to project budget, estimated and actual costs, and scheduled information across a portfolio of projects.
- Portfolio managers can track project financials for their projects in one, single location.
- Data is presented in bar charts which provide a quick and accurate health check of project financials.
- The dashboard enables integration with external ERP systems to have a single source of truth for all viewers, and provides access to detailed project cost sheets and schedules to monitor progress and critical path, enabling users to make informed decisions.
Pre-requisites
- An active Asite subscription on your Asite account
- An active Power BI Pro (minimum) license